
Protecting Aquifers and Watersheds in the Southern Tier
References for communities looking to protect aquifers and watersheds
Links for the resources described in a presentation given in Candor, New York on March 27, 2013.
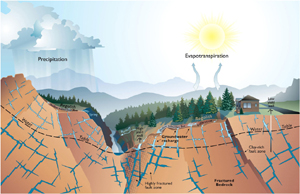
What is an Aquifer?
See http://www.maine.gov/doc/nrimc/mgs/explore/water/facts/aquifer.htm.
- An aquifer is a water-bearing geologic formation capable of yielding a usable amount of ground water to a well.
- Groundwater is not static; it flows.
- The direction of the flows are important to understand.
- Once in groundwater, contaminants are sometimes able to migrate considerable distances over time.
- Once groundwater is contaminated, it is very difficult and expensive to correct.
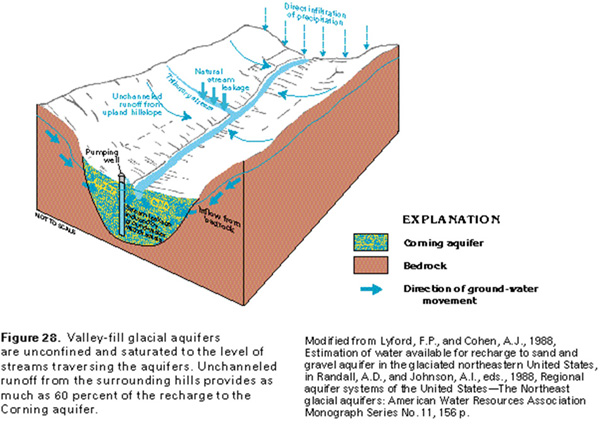
Cross-section of a Valley Fill Aquifer
The diagram illustrates how the Corning valley fill aquifer is incised into the bedrock. Figure 28 from Surficial Aquifer System, Valley-Fill Glacial Aquifers, Ground Water Atlas of the United States, USGS publication HA 730-M, http://pubs.usgs.gov/ha/ ha730/ch_m/M-text1.html. "The Corning aquifer is an example of a valley-fill glacial aquifer deposited by meltwater streams that drained away from stagnated or melting glacial ice in upland valleys. It is characteristic of many such glacial-drift aquifers in the Appalachian Plateaus. The aquifer occupies four deeply incised bedrock valleys formed by the junction of the Chemung River and its principal tributaries, the Canisteo, the Tioga, and the Cohocton Rivers, in southeastern Steuben County, N.Y. The valleys are incised deeply into flat-lying shaly carbonate bedrock."
Cross-section of a Fractured Bedrock Aquifer
Illustration of an aquifer system in fractured bedrock, Figure 7.5.3, http://geosurvey.state.co.us/ apps/wateratlas/chapter7_5page2.asp. The newly released USGS report on certain aquifers in the Susquehanna River valley points out that the aquifers in the upland areas of our regional watersheds are fractured bedrock aquifers. See Hydrogeology of the Susquehanna River Valley-Fill Aquifer System and Adjacent Areas in Eastern Broome and Southeastern Chenango Counties, New York, by Paul M. Heisig, Scientific Investigations Report 2012–5282, prepared in cooperation with NYS DEC, http://www.usgs.gov/newsroom/article.asp? ID=3524.
Aquifer Maps and Diagrams
Map of Primary and Principal Aquifers in NYS
Figure 2.1 of the Revised Draft SGEIS, page 2-21. Click here for PDF of Figure 2.1. Primary aquifers are defined as "highly productive aquifers presently utilized as sources of water supply by major municipal water supply systems." Principal aquifers are "aquifers known to be highly productive or whose geology suggests abundant potential water supply, but which are not intensively used as sources of water supply by major municipal systems at the present time." See http://www.dec.ny.gov/lands/36119.html.
Closeup of Our Area
Closeup of map above showing that 11 of New York's 18 primary aquifers are located in our area.
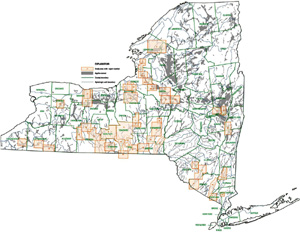
Many New York Aquifers Are Not Mapped in Detail
Map showing which aquifers in upstate New York have been mapped in detail by USGS. See http://ny.water.usgs.gov/projects/bgag/ aquifer.maps/aquifer1.maps.html. As is apparent from the map, only some aquifers have been mapped. John H. Williams, USGS Groundwater Specialist, testified to the NYS Assembly hearing on the DEC's proposed fracking regulations January 10, 2013, that "the valley fill aquifers found in upstate New York are some of the most important aquifers in the state." He said approximately 375 miles of valley fill aquifers in the Southern Tier have not been mapped at a detailed level. "Thus a substantial portion of the area with the highest potential for shale gas development lacks the basic hydrogeologic information needed to assess these aquifers, including their spatial extent." See http://www.youtube.com/ watch?v=WjuXg9f7jVU, testimony beginning at 10:10. The remarks quoted are at the beginning of his testimony. Mr. Williams' testimony on this issue was highlighted by Assemblyman Steve Englebright, himself a geologist, when he questioned DEC Commissioner Martens during the Assembly Budget hearing on Feb. 4, 2013. See http://www.youtube.com/watch?v= IDNm9wfFsUc#t=2h21m at 2:24:40. Mr. Martens responded that all New York's primary and principal aquifers have been mapped in sufficient detail. A comparison of the map on the left with the primary and principal aquifer map above demonstrates that a majority of the principal aquifers in the state have not been mapped. The DEC website states that "All of the Primary Aquifers have been mapped in detail at a scale of 1:24,000." See http://www.dec.ny.gov/lands/36119.html.
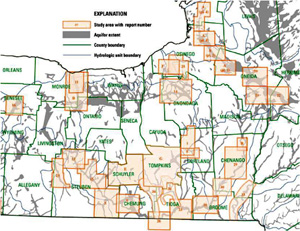
Aquifer Mapping in Our Area
UPDATE: The USGS map of aquifers has been updated since the presentation to show the locations of two recently released USGS aquifer reports. These reports and accompanying maps are the most detailed and comprehensive reports and maps produced in the ongoing effort of USGS and the DEC to issue detailed maps of New York's aquifers. The report released on March 13, 2013, maps the section of the Susquehanna River Valley is number 33 on the map. The report on the Cayuta Creek and Catatonk Creek valley aquifers released in August 2012, is number 34 on the map.
Map of the Owego Aquifer
The Owega aquifer is one of New York's 18 primary aquifer. The aquifer was mapped in detail by the USGS in 1989. See Hydrogeology of the valley-fill aquifer at Owego, Tioga County, New York, by Richard J. Reynolds, and James D. Garry, USGS Water-Resources Investigations Report: 89-4000 (1989), http://pubs.er.usgs.gov/publication/wri894000. The map of the Owego aquifer is section 27 on the map of aquifer reports above.
Closeup of the Owego Aquifer Map
A close-up of the map shows that individual wells in the aquifer are mapped. The Owego map does not show the boundaries of the aquifer's watershed.
New USGS Report on the Cayuta Creek amd Catatonk Creek Aquifers
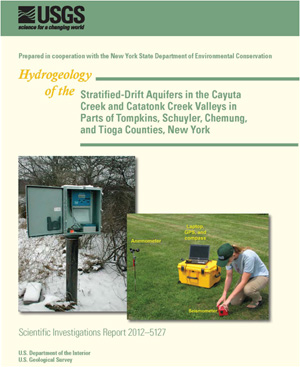
In August 2012, USGS released Hydrogeology of the Stratified-Drift Aquifers in the Cayuta Creek and Catatonk Creek Valleys in Parts of Tompkins, Schuyler, Chemung, and Tioga Counties, New York, Todd S. Miller and Lacey M. Pitman, USGS Scientific Investigations Report: 2012-5127, http://pubs.er.usgs.gov/publication/sir20125127
Map of the Cayuta Creek and Catatonk Creek Aquifers
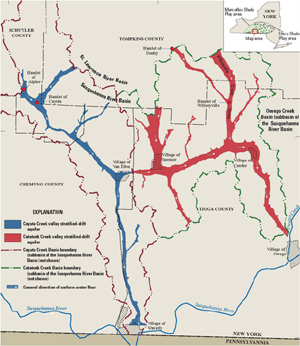
Figure 1. Location of Cayuta Creek and Catatonk Creek stratified-drift aquifers in parts of Tompkins, Schuyler, Chemung, and Tioga Counties, New York, page 3 of Hydrogeology of the Stratified-Drift Aquifers in the Cayuta Creek and Catatonk Creek Valleys in Parts of Tompkins, Schuyler, Chemung, and Tioga Counties, New York, Todd S. Miller and Lacey M. Pitman, USGS Scientific Investigations Report: 2012-5127, http://pubs.er.usgs.gov/publication/sir20125127. Note that watershed boundaries are mapped.
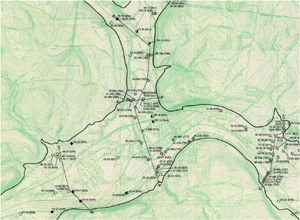
Section of Map of the Cayuta Creek and Catatonk Creek Aquifers
Close-up of a section of Plate 1, Stratified-drift aquifers, basin boundaries, and location of wells, test borings,
geohydrologic lines of sections, and horizontal-to-vertical (H/V) ambient-noise seismic surveys in the Cayuta Creek and Catatonk Creek valleys, in parts of Tompkins, Schuyler, Chemung, and Tioga Counties, New York, Hydrogeology of the Stratified-Drift Aquifers in the Cayuta Creek and Catatonk Creek Valleys in Parts of Tompkins, Schuyler, Chemung, and Tioga Counties, New York, 2012, Todd S. Miller and Lacey M. Pitman, USGS Scientific Investigations Report: 2012-5127, http://pubs.usgs.gov/sir/2012/5127/, http://pubs.usgs.gov/sir/2012/5127/plates.html.Map Showing Major Fault Lines in the Cayuta Creek and Catatonk Creek Aquifers
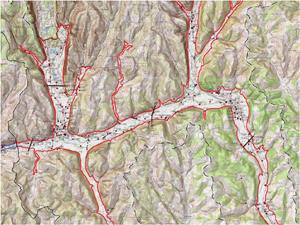
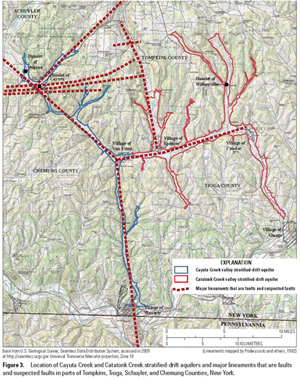
Figure 2, Location of Cayuta Creek and Cataonk Creek stratified-drift aquifers and major lineaments that are faults and suspected faults, page 6 of Hydrogeology of the Stratified-Drift Aquifers in the Cayuta Creek and Catatonk Creek Valleys in Parts of Tompkins, Schuyler, Chemung, and Tioga Counties, New York, 2012, Miller, Todd S.; Pitman, Lacey M., USGS Scientific Investigations Report: 2012-5127, http://pubs.er.usgs.gov/publication/sir20125127
"Many of the valley reaches in the study area follow predominant lineaments (fig. 3), some of which reflect zones of concentrated fractures, known faults, and 'suspected faults' (Jacobi, 2002; Podwysocki and others, 1982; Pohn, 1981; and Stone & Webber, 1978). These zones of concentrated fractures and faults controlled the development of the configuration of the major valleys in the study area. The drainage pattern of Catatonk Creek valley has a conspicuous reticular pattern that suggests it was controlled by lineaments and which contrasts with the dendritic drainage pattern present in the uplands where valley configuration is less influenced by lineaments. Although, the presence of concentrated fracture zones and faults in these valleys was not confirmed everywhere because of a sparsity of deep well logs, their presence was based on several other sources of data including: (1) digital contrast enhancement of several Landsat multispectral scanner images, (2) analysis of lineament patterns from a Landsat MSS-7 mosaic, (3) field mapping of bedrock joint patterns, (4) compilation and analysis of surface and subsurface structure and isopach maps, (5) collection and digital analysis of aeromagnetic data for southern New York, (6) compilation and analysis of aeromagnetic and gravity data for much of New York and Pennsylvania, and (7) analysis of seismic reflection survey lines for selected portions of New York and Pennsylvania.
" Some faults and fractures result in disturbed zones of crushed rock, which locally enhance the secondary permeability of the rock. If the faulted zones were not sealed by precipitation of minerals from hydrothermal fluids, then the secondary permeabilty along these zones could act as conduits through which groundwater (as well as methane-rich fluids) may migrate (Fountain and Jacobi, 2000). Some fracture zones and faults are vertical to near-vertical and pass through gently dipping strata that act as confining units, thereby creating a local hydraulic connection between vertically-stacked geohydrologic units. For example, when a 2,900-ft-deep vertical well (well 29, Jacoby and Dellwig, 1974) at the Watkins Glen brine field (fig. 2) was hydraulically fractured, brine flowed up to land surface reportedly through a large north-south trending shear fault that has an estimated 1,200 ft horizontal displacement (Jacoby and Dellwig, 1974). Likewise, should vertical faults extend from a gas-producing formation to beneath the bottom of the stratified-drift aquifers in the valleys, it also is possible that methane, methane-rich fluids, and fracking fluids could migrate upward via the faults during the hydrofracking of the gas-producing formation and contaminate sand and gravel aquifers. Because of the presence and nature of these fracture zones, it is important that hydrofracking operations evaluate the presence of major faults and zones of concentrated fractures in order to avoid the risk of gases and fluids migrating upward and contaminating shallow aquifers that are sources of potable water to many residents and communities." Pages 5-7 of Report cited, emphasis added.
Basement Faults in New York
Basement faults and seismicity in the Appalachian Basin of New York State, Robert D. Jacobi , Geology Department, University of Buffalo, http://www.sciencedirect.com/science/ article/pii/S0040195102002780
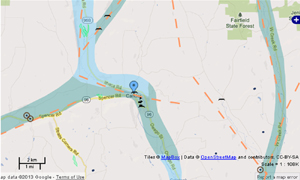
Toxics Targeting’s Interactive Map of Candor, NY
The Marcellus Shale layer of the map illustrates gas and oil wells, groundwater aquifers, abandoned and unplugged production wells and geologic faults. Each of these can be seen on the map of Candor opposite. See http://maps.toxicstargeting.com/.
New USGS Report on Susquehanna River Valley-Fill Aquifers
On March 13, 2013, USGS released Hydrogeology of the Susquehanna River Valley-Fill Aquifer System and Adjacent Areas in Eastern Broome and Southeastern Chenango Counties, New York, Paul M. Heisig, Scientific Investigations Report 2012–5282, http://www.usgs.gov/newsroom/ article.asp?ID=3524. The report describes the upland areas of our regional watershed and the fractured bedrock aquifers in those upland areas. The report points out the close connections between the uplands and the valley aquifers: "If water quality in those streams [flowing from the uplands] is compromised by activites in the upland watershed, groundwater quality in the valley may, in turn, be degraded; therefore, the maintenance of good water quality in the upland watersheds that are the source of these streams is an important aspect of protecting the Susquehanna River valley-fill aquifer system."
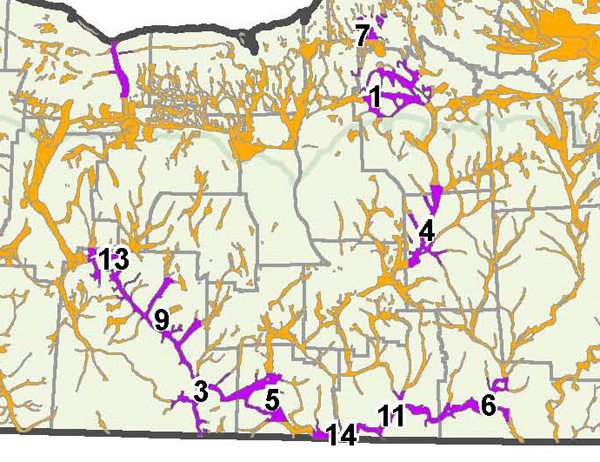
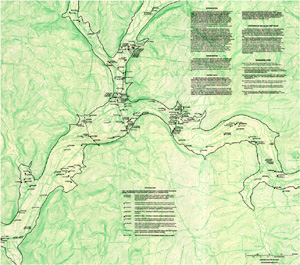
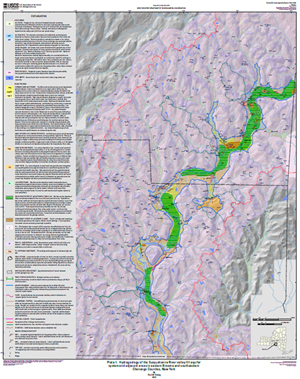
Map of the Hydrogeology of the Susquehanna River Valley-Fill Aquifer System
Plate, Hydrogeology of the Susquehanna River Valley-Fill Aquifer System and Adjacent Areas in Eastern Broome and Southeastern Chenango Counties, New York, Scientific Investigations Report 2012–5282 By Paul M. Heisig, Prepared in cooperation with New York State Department of Environmental Conservation http://www.usgs.gov/newsroom/article.asp?ID=3524
From the Summary, pp. 17-18 "Water-resource development in the region is mostly in the form of domestic wells; three villages provide community supplies. Most domestic wells in upland areas tap the fractured bedrock aquifer. Domestic wells in the Susquehanna River valley may tap sand and gravel deposits with open-ended well casings or may be completed as bedrock wells that are cased through the valley-fill deposits. Community supplies consist of screened production wells that tap sand and gravel deposits beneath or adjacent to alluvial fan deposits. Some of these wells may induce infiltration of Susquehanna River water."
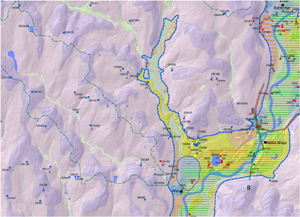
Close-up of Map Above
"Water-resource protection of the Susquehanna River valley-fill aquifer includes not only aquifer extent, but also upland areas that contribute water to the aquifer such as adjacent hillsides that drain directly to the Susquehanna River valley, and the drainage areas of tributary streams that lose water to the aquifer upon entering the valley. Of particular note are watersheds of streams that contribute water through alluvial fans where there are currently (2012) withdrawals for public supply. Lastly, protection of water resources in upland areas can include restriction of activities that may compromise groundwater quality in areas where till is thin over bedrock or where bedrock crops out at land surface."
"Groundwater in bedrock in upland areas is far more susceptible to contamination in areas with thin till or exposed bedrock than where till is several tens of feet thick. Contamination in these areas would migrate downslope through shallow fractures in the upper 100–150 ft of bedrock; therefore, avoidance of activities that could potentially degrade groundwater quality in areas of thin till or exposed bedrock (plate 1) in favor of areas with thick till (greater than 50 ft) can minimize adverse effects on nearby domestic wells."
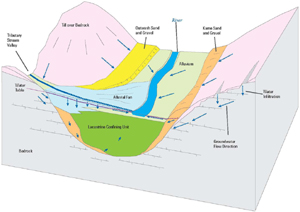
Diagram of groundwater flow in the Susquehanna valley-fill aquifer system
Figure 10. Conceptual block diagram of groundwater flow in the Susquehanna valley-fill aquifer system.
“If water quality in those streams [flowing from the uplands] is compromised by activities in the upland watershed, groundwater quality in the valley may, in turn, be degraded; therefore, the maintenance of good water quality in the upland watersheds that are the source of these streams is an important aspect of protecting the Susquehanna River valley-fill aquifer system.”
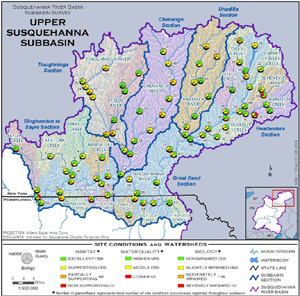
SRBC Watershed Map of the Upper Susquehanna Subbasin
Site Conditions and Watersheds Map from the Susquehanna River Basin Commission's Upper Susquehanna Subbasin Atlas Maps Current Projects: Upper Susquehanna Year 1 Subbasin Survey, http://www.srbc.net/atlas/upperSbSurveyY1_2008.asp. The SRBC's 2007 Upper Susquehanna Subbasin Survey of water quality can be downloaded at http://www.srbc.net/pubinfo/techdocs/ publication_260/techreport260.pdf.
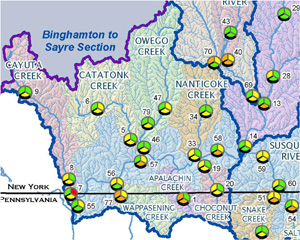
Binghamton to Sayre Section of the SRBC's Upper Susquehanna Subbasin Watershed Map
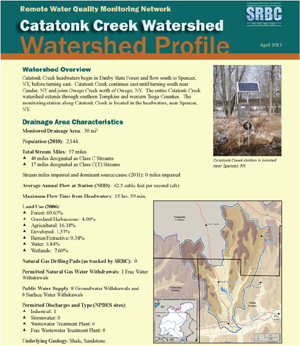
SRBC Monitoring Station Watershed Profiles
The Susquehanna River Basin Commission (SRBC) initiated the Remote Water Quality Monitoring Network (RWQMN) in January, 2010. This monitoring network continuously measures and reports water quality conditions of smaller rivers and streams located in northern tier Pennsylvania and southern tier New York. See http://mdw.srbc.net/remotewaterquality/default.aspx
The monitoring network provides constant data collection with instruments sensitive enough to detect subtle changes in water quality on a frequency that will allow background conditions and any changes to them to be documented throughout the year.
Profiles are published for each remote monitoring location, including Upper Catatonk Creek, http://mdw.srbc.net/remotewaterquality/ watershed_profiles/catatonk.htm
Using Local Laws to Protect Aquifers
Zoning to Create Aquifer Protection Districts
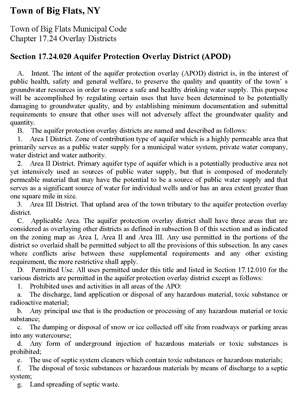
Big Flats Aquifer Protection Overlay District
The Big Flats ordinance creating an aquifer protection district is posted at http://landuse.law.pace.edu/landuse/ documents/ laws/reg2/LandUseCenter5.doc. State Law authorizes cities, towns and villages in New York to enact zoning laws. Zoning is optional, not required. The statutes governing zoning and planning in towns are set forth in Town Law Article 16. Similar provisions for villages are set forth in Village Law Article 7, and for cities within General City Law Article 2-A. Cities also draw authority from their individual charters. The Town and Village Laws set forth the procedures for adopting zoning regulations, including proper notice and public hearings. See Town Law §264; Village Law §7-706. Adoption of zoning regulations is subject to the State Environmental Quality Review Act (“SEQRA”), see Town Law §264(3); Village Law §7-706(4), and the initial adoption of zoning regulations is classified as a “Type I action.” 6 N.Y.C.R.R. §617.4(b)(1). Furthermore, referral of the law to the county planning agency or regional planing council is required under General Municipal Law §239-m. See Zoning Framework, Alan J. Knauf, Esq., http://www.nyenvlaw.com/Data/Documents/ Zoning%20Framework.pdf
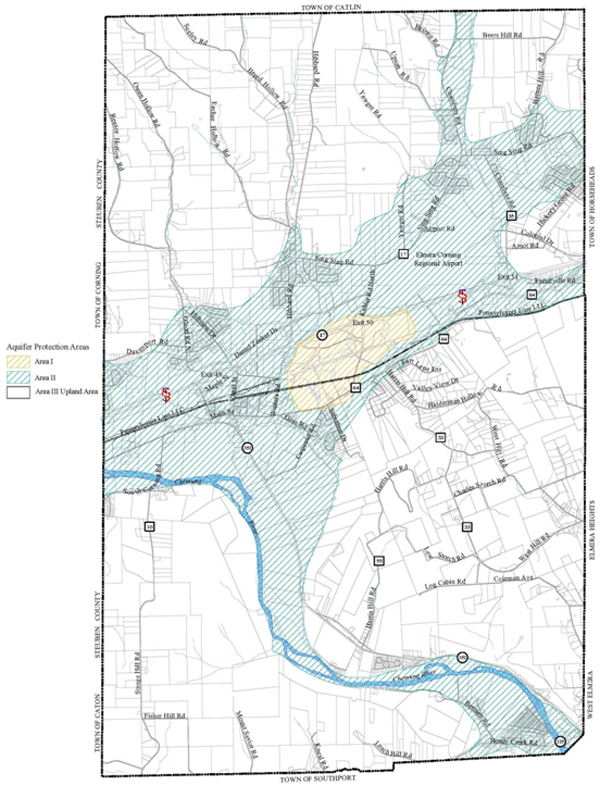
Map of Aquifer Protection District, Town of Big Flats, New York
Map is posted at http://www.bigflatsny.gov/uploads/Main/ Town_Aquifer_Protection_Zone_Map.pdf. The Big Flats Comprehensive Plan describes the district: "The Aquifer Protection Overlay District (APOD) is intended to preserve the quality and quantity of the town’s groundwater resources to ensure a safe drinking water supply. The district has three areas that are overlaying other districts, Area I, Area II, and Area III. Area I is the area of the aquifer that is highly permeable and primarily serves as a public water supply for a municipal water system. Area II is the area of the primary aquifer, which, although it may potentially be a productive water source, is not yet used intensively as a public water source. Area III is the upland area of the town tributary to the aquifer protection overlay district. The APOD provides a list of certain prohibited uses, and in addition gives the Planning Board, through the site plan review process, the authority to request additional information from professional hydro-geologists or other experts for certain potentially harmful commercial and industrial uses proposed within the APOD." See http://www.bigflatsny.gov/uploads/Govt/ Big_Flats_Comprehensive_Plan.pdf, page 32.
Local Laws other than Zoning
"Local Authority to Adopt Environmental Laws," John Nolon, Pace Law School Land Use Center, http://www.law.pace.edu/landuse/loc_envlaw2_nolon.html
"Home Rule in New York 1941-1965: Retrospect and Prospect," J. D. Hyman, 15 Buff. L. Rev. 335 (1965-1966)
"Home Rule and the New York Constitution," Samuel Estreicher, Columbia Law Review, Vol. 66, No. 6 (Jun., 1966), pp. 1145-1163, http://www.jstor.org/stable/1121001
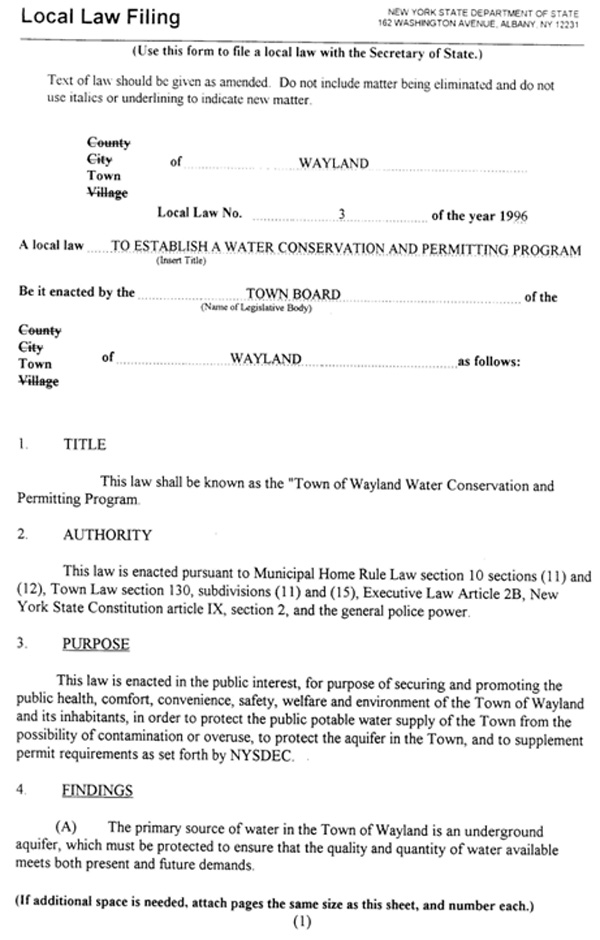
Town of Wayland, NY Water Conservation and Permitting Program
Local law adopted in 1996. Download from http://townofwayland.org/content/Laws/View/ 20:field=documents;/content/ Documents/File/23.pdf. The Findings section of the law states:
(A) The primary source of water in the Town of Wayland is an underground aquifer, which must be protected to ensure that the quality and quantity of water available meets both present and future demands.
(B) Groundwater quality samples taken from the former Wayland landfill have exceeded standard for some inorganic parameters established by NYSDEC for groundwater. Pressure reduction in the aquifer, and the increased gradient produced by additional pumping, might increase the downward and lateral migration rate of these contaminants, migration of these contaminants into the water supply could have a detrimental effect on water quality for wells within the flow path of the aquifer.
(C) After recent temporary increases in groundwater pumping, numerous residents of the Town of Wayland experienced one or more of the following conditions: ( 1) loss of water, (2) low water; (3) cloudy or muddy water; and (4) bad tasting and/or bad smelling water.
(D) The tax base of the Town will suffer adverse effects if water quality and/or quantity problems are not addressed in such a way as to protect future development, and the property values of existing residences and businesses.
(E) If water conservation and permitting programs are not instituted, irreparable damage may be done to the local aquifer; the local environment and property values in the Town.Critical Environmental Areas
New Yorks SEQRA regulations provide that local agencies may designate specific geographic areas within their boundaries as Critical Environmental Areas (CEAs). To be designated as a CEA, an area must have an exceptional or unique character with respect to one or more of the following: a benefit or threat to human health a natural setting, e.g., fish and wildlife habitat, forest and vegetation, open space, scenic quality agricultural, social, cultural, historic, archaeological, recreational, or educational values; or an inherent ecological, geological or hydrological sensitivity to change that may be adversely affected by any change. Following designation as a CEA, the potential impact of any Type I or Unlisted Action on the environmental characteristics of the CEA is a relevant area of environmental concern and must be evaluated in the determination of significance prepared pursuant under SEQRA. See http://www.dec.ny.gov/permits/6184.html.
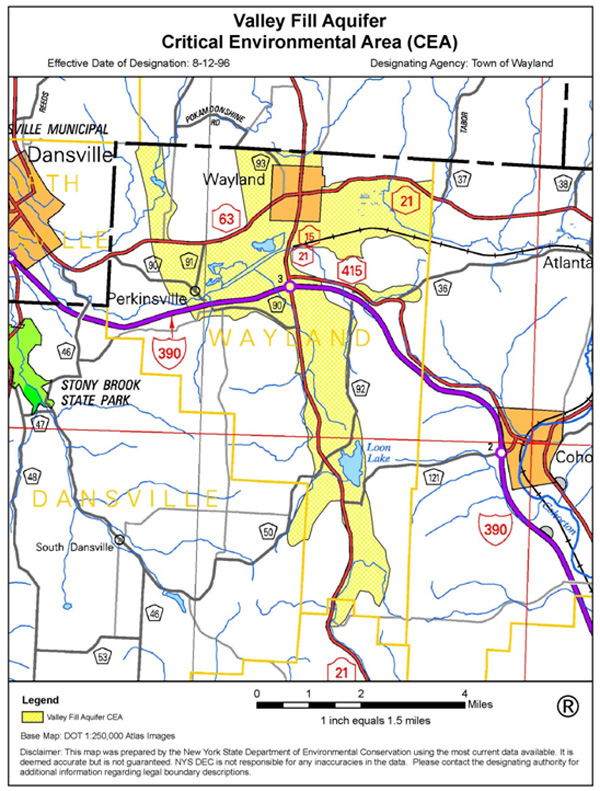
Map of Wayland Valley Fill Aquifer Critical Environmental Area
From http://www.dec.ny.gov/docs/permits_ej_ operations_pdf/valley.pdf. The Wayland CEA was established in conjunction with local water conservation and permitting law referenced above. According to the DEC website, the Wayland CEA is the only CEA in Steuben County. The DEC lists CEAs by county on its website at http://www.dec.ny.gov/permits/6184.html.
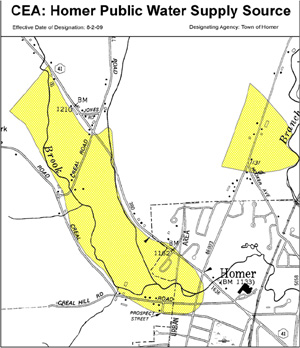
Map of Home Public Water Supply Source Critical Environmental Area
Sole Source Aquifers
Map of Sole Source Aquifers in New York
Sole source aquifers are designated by the EPA pursuant to the Safe Drinking Water Act. A sole source aquifer is defined as one which supplies at least fifty percent (50%) of the drinking water consumed in the area overlying the aquifer. There can be no alternative drinking water sources that could physically, legally, and economically supply all those who depend upon the aquifer for drinking water. SSA designations are made in response to a petition from the locality, and after public hearing. All Federal financially assisted projects that have the potential to contaminate the SSA area are subject to review by the EPA. State and local governmental agencies may have to more closely scrutinize a project before granting a permit in an SSA. For example, the NY Environmental Conservation Law requires that any person seeking a SPDES permit or a renewal within an area designated as a sole source aquifer, shall include as a part of the required information, the name and address of all public water purveyors with a service area within three miles of the applicants facility. For more information about the EPA's Sole Source Aquifer Protection Program visit http://water.epa.gov/infrastructure/drinkingwater/ sourcewater/protection/solesourceaquifer.cfm
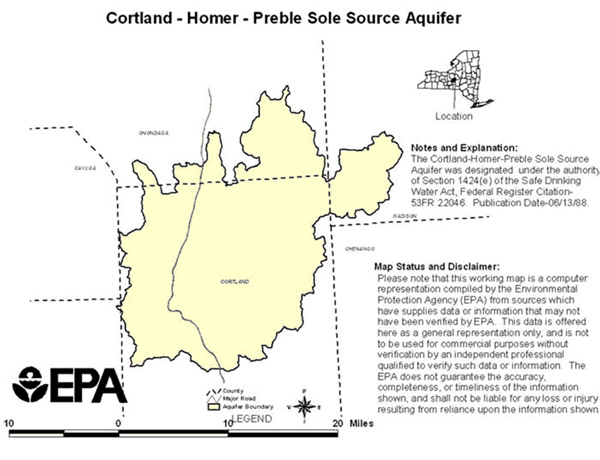
Map of the Cortland Homer Preble Sole Source Aquifer
The Cortland Homer Preble SSA was designated in 1988 in response to a petition from the Cortland County Legislature. The Cortland-Homer-Preble Aquifer System underlies portions of Cortland and Onondaga Counties, New York. It is the sole source of drinking water for the 35,000 residents in the aquifer service area; There are no viable alternative drinking water sources of sufficient supply; and if contamination were to occur, it would pose a significant hazard to public health. See Cortland Homer Preble Aquifer System, US EPA Region 2, http://www.epa.gov/region2/water/aquifer/cortland/ fr_cortl.htm#I9
Municipal Compacts
In 1960, the New York legislature authorized local governments to cooperate by entering into inter-municipal agreements for the performance of their respective functions, powers, and duties and allows them to cooperate regarding land use planning, regulation, and administration with the enactment of Article 5-G of the General Municipal Law. In 1993 the state legislature authorized county governments to assist constituent localities in land use matters. The 1993 amendments modified General Municipal Law §§ 119-u and 239-d, as well as General City Law § 20-g, Town Law § 284 and Village Law § 7-741. Pursuant to these amendments, a county planning agency can act in an advisory capacity, assist in the preparation of a comprehensive plan, assist in the preparation of land use regulations, and participate in the formation of individual or joint administrative bodies. For more information, see Grassroots Regionalism Under New York Law: Encouraging Intermunicipal Land Use Compacts, John R. Nolon, March 1999, http://digitalcommons.pace.edu/cgi/viewcontent.cgi?article=1177&context=lawfaculty.
Keuka Watershed Improvement Cooperative
The Keuka Watershed Improvement Cooperative (KWIC) was formed by inter-municipal agreement in 1993 of the six towns and two villages bordering Keuka Lake. The previous watershed organization known as the Keuka Lake Perimeter Committee became dysfunctional in the early 1980's after several towns pulled out of the agreement. The Keuka Lake municipalities determined that tourism and tax base depend on a clean and healthy lake. Local tourism generates nearly $50 million dollars a year, and the real property tax base along the lake represents an estimated $1 billion (up to 70% of all assessed value in many towns). For more information about KWIC, see http://keukawatershed.com/ and http://www.keukalakeassoc.org/how/wq_kwic_ history.php
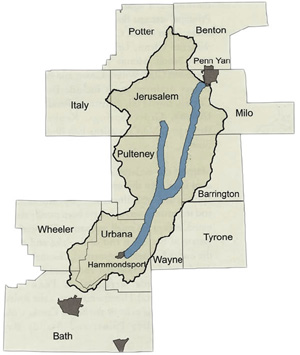
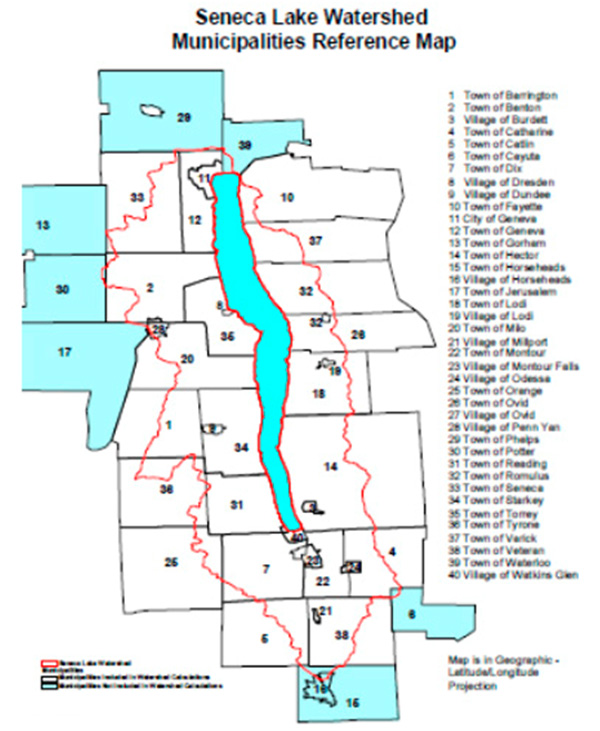
Proposed Seneca Lake Municipal Partnership
The Seneca lake Pure Waters Association (SLPWA) recently sent a letter sent to all the counties, towns, cities and villages bordering Seneca Lake suggesting the formation of an intermunicipal Seneca Lake watershed agreement. The letter states, "By actions taken or not taken within its boundaries, each municipality within the Seneca Lake watershed has an influence over the ecology and water quality of Seneca Lake and its tributaries. We believe that a partnership across all municipalities in the watershed dedicated to enhancing and preserving the quality of Seneca Lake would be in the long term interests of our communities and the Finger Lakes." See http://www.senecalake.org/
Watershed Associations
According to the U.S. EPA website, the EPA has been promoting a watershed approach as a mechanism of water protection since 1991. See http://water.epa.gov/type/ watersheds/nycityfi.cfm. The SRBC publishes a list of Watershed and Lake Associations in the Susquehanna River Basin, March 2005, http://www.srbc.net/ atlas/_old_site/ image/86a_WshedOrgs_list.pdf
Citizens for Catatonk Creek
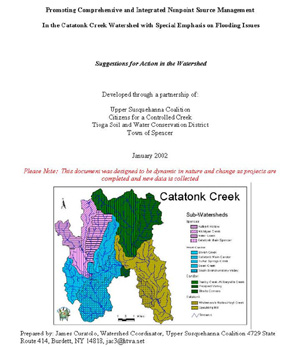
Worked with other groups in the watershed to prepare a Catatonk Creek Watershed Management plan in January 2002. The plan, titled Promoting Comprehensive and Integrated Nonpoint Source Management in the Catatonk Creek Watershed with Special Emphasis on Flooding Issues, can be downloaded at http://www.u-s-c.org/html/documents/CatatonkStrategicPlan.pdf
Cayuta Catatonk Water Watch and Community Science Institute in Ithaca
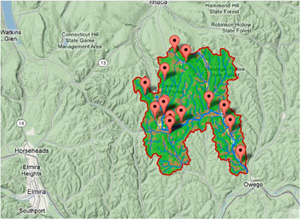
CCWW is a volunteer water monitoring group that monitors the Cayuta and Catatonk watersheds. The group partners with the Community Science Institute in Ithaca for technical assistance, quality control and assurance and display of their data on the CSI web-site.
CCWW has 28 volunteers testing 25 sites each month for 5 parameters: Temperature, pH, conductivity, total dissolved oxygen and total hardness. This data helps establish a picture of the overall health of the watersheds. See Catatonk Creek Monitoring Sites, http://www.communityscience.org/ database/monitoringsets/13Cayuta Lake Property Owners Association
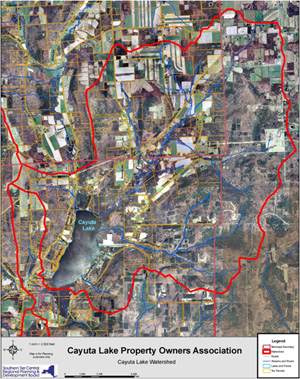
A map of the Cayuta Lake watershed showing tax parcels within the watershed is posted online at http://stcplanning.org/usr/Program_Areas/ Water_Resources/Stormwater/Small_Lakes/ Cayuta%20Lake4.pdf
New York City Watershed Agreement
The map of New York City's water supply system is online at http://www.cwconline.org/maps/nyc.html. In 1997 a number of federal, state, county, municipal and private organizations signed a New York City Watershed Agreement Memorandum of Understanding. EPA worked with New York City, New York State, and local communities to implement watershed protection requirements in the Catskill/Delaware watersheds using Safe Drinking Water Act requirements as the “driver.” Under the agreement New York City regulates watershed land uses and supports upstate/downstate partnership programs. New York State has adopted the City's watershed regulations and land acquisition permits and established a new Watershed Inspector General’s Office and an Office of the NYCWP within the DEC to ensure City regulations are implemented. Upstate community representatives participate in a regional watershed partnership council. See http://water.epa.gov/type/ watersheds/nycityfi.cfm and http://www.dec.ny.gov/lands/25599.html.

Map of NYC Watershed Conservation Easements
Map of West of Hudson Watershed Properties with WAC Easements, DEP Easements, DEP Fee Lands and State Lands, Dec. 2011, http://www.nycwatershed.org/ ce_aboutmap.html. The Watershed Agricultural Council (“WAC”) is a non-profit organization funded by NYC, U.S.D.A, U.S. Forest Service and other funding sources. WAC works with farm and forest landowners in the New York City Watershed region to protect water quality in the watershed. "WAC has a dual mission: to address surface-water quality through land conservation while supporting the economic viability of agriculture and forestry in the watershed region. A Whole Farm Plan or Forest Management Plan incorporates a number of water-quality improvements, mitigation approaches and common sense measures, called best management practices or BMPs. These BMPs, along with land conservation techniques and team planning, are tailored to that farming or forested property. Similarly, conservation easements placed on watershed farms and woodlands ensure working landscapes are protected for future generations. Strong agriculture-focused and forestry-based industries bolster the local watershed economy. The natural environment, complimented by WAC’s water-quality protection programs, not only serves as New York City’s watershed, but as its viewshed and foodshed, too." See http://www.nycwatershed.org/aw_description.html.
NYCDEP WOH Non-Watershed Infrastructure Impact Evaluation and Comments to DEC
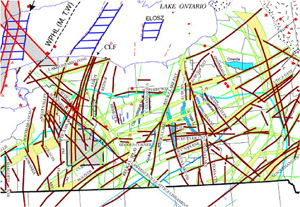
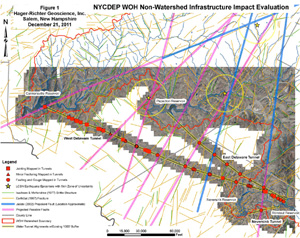
Fig. 1, page 57 of Attachment B, Technical Memorandum: Geophysical Evaluation of Infrastructure Risks of Natural Gas Production On New York CityWest of Hudson (WOH) Water Supply Infrastructure, Hager-Richter Geoscience, Inc., New York City Department of Environmental Protection Comments on the Revised Draft Supplemental Generic Environmental Impact Statement on the Oil, Gas and Solution Mining Regulatory Program, January 11, 2012, http://www.nyc.gov/html/dep/pdf/ natural_gas_drilling/ nycdep_comments_on_rdsgeis_for _hvhf_20120111.pdf. "High resolution orthoimagery . . . was examined for this project. Previously unknown projected possible faults that cross the tunnel alignments were interpreted, and the resultsof the analysis are shown in Figure 1. In addition, the approximate locations of the N-S trending
faults interpreted by Jacobi are shown on Figure 1. The interpreted faults show good correspondence with faults and brittle features encountered during tunnel construction." p. 43 Attachment B. "The subsurface formations underlying and in the vicinity of the WOH NWI are much more complexly jointed and faulted than indicated in the RDSGEIS, . . . . The faults could extend to the depths of the Marcellus Shale." p. 46, Id.
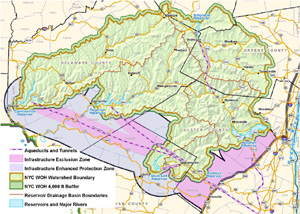
Proposed Infrastructure Buffers in Comments to DEC
Attachment A, page 16 of comments cited above, showing 4,000 ft. setback from the watershed contained in the proposed hydrofracking regulations and several miles of proposed setbacks from the water tunnels.
IMPORTANT LEGAL DISCLAIMER: These reference materials are published for educational purposes only. The matters discussed in the presentation are general in nature and are incomplete descriptions of the law. Nothing in this presentation constitutes legal advice or an offer of legal advice. You should contact your attorney to obtain advice with respect to any particular issue or problem.


Hammondsport, New York 14840
607-569-2114, info at treichlerlawoffice.com
LLI Profile, Client Log-In